# Load these libraries
library(ggplot2)
library(dlstats)
library(tibble)

# Create the wrapper function
package_trackeR <- function(packages) {
  # Create the downloads for the package
  dl <- dlstats::cran_stats(c(packages))
  # Create the plot
  plot <- ggplot(
    dl,
    aes(end, downloads, group = package)
  ) +
    geom_line(aes(color = package), linetype = "dashed") +
    geom_point(aes(shape = package, color = package)) +
    theme_minimal()
  plot <- plot + xlab("Download date") +
    ylab("Number of downloads")
  # Create a list for multiple returns
  returns_list <- list(
    "download_df" = as_tibble(dl),
    "downloads_to_date" = sum(dl$downloads),
    "downloads_plot" = plot
  )

  return(returns_list)
}I had the privilege of tapping into the R package funding stream to fund my first, and not last, CRAN package entitled NHSDataDictionaRy.
The motivation for the package was to provide a consistent way to scrape the live NHS Data Dictionary website. The aim was to allow the lookups to always be up to date and to allow R users in the NHS to quickly get key NHS and medical lookup and reference files. This package also provides other generic web scraping functions that can be utilised with other websites.
Slight digression – if you have a package idea that you think needs to be developed, then please fill in an NHS-R package proforma to put your proposal to the central team at NHS-R for consideration.
Who is using my package?
The motivation for this quick package wrapper was to find a way to track how often my package had been downloaded from CRAN, as I am a statistician by trade and have also worked in performance analysis, so I like to monitor the downloads from a sanity and return on investment viewpoint. In addition, I am rather curious to know if the package is being successful.
The first thing to do is to load the {dlstats} library in to my simple wrapper function to allow for the packages to be summarised in terms of downloads per month and to date. The package list creates three components in the R list, these are:
Plot of downloads over time
A tibble (a fancy tidy data frame) of the downloads per package per month, if multiple packages are passed to the vector then you will get multiple results you can interrogate
Downloads_to_date this is a summary of all the downloads to date
Creating the function wrapper
The function wrapper looks as below:
To decompose what this is doing:
The dl variable uses the {dlstats} package to download a vector of packages. The vector is denoted by the `c()` wrapper, this just allows you to pass multiple packages (as string inputs) to the function
The plot creates a plot of all the downloads for the chosen package(s) and displays them on a line chart.
The output of this returns the artefacts as stated in the precursory section.
Using the function
To use, or call, the new function we instantiate or utilise it, as below:
# Call the new function
tracking <- package_trackeR(c("NHSDataDictionaRy"))
I simply now pass my vector of packages to the function and this returns the following associated outputs.
tracking$download_df# A tibble: 45 × 4
start end downloads package
<date> <date> <int> <fct>
1 2021-01-01 2021-01-31 129 NHSDataDictionaRy
2 2021-02-01 2021-02-28 526 NHSDataDictionaRy
3 2021-03-01 2021-03-31 502 NHSDataDictionaRy
4 2021-04-01 2021-04-30 155 NHSDataDictionaRy
5 2021-05-01 2021-05-31 484 NHSDataDictionaRy
6 2021-06-01 2021-06-30 452 NHSDataDictionaRy
7 2021-07-01 2021-07-31 571 NHSDataDictionaRy
8 2021-08-01 2021-08-31 529 NHSDataDictionaRy
9 2021-09-01 2021-09-30 369 NHSDataDictionaRy
10 2021-10-01 2021-10-31 546 NHSDataDictionaRy
# ℹ 35 more rowstracking$downloads_plot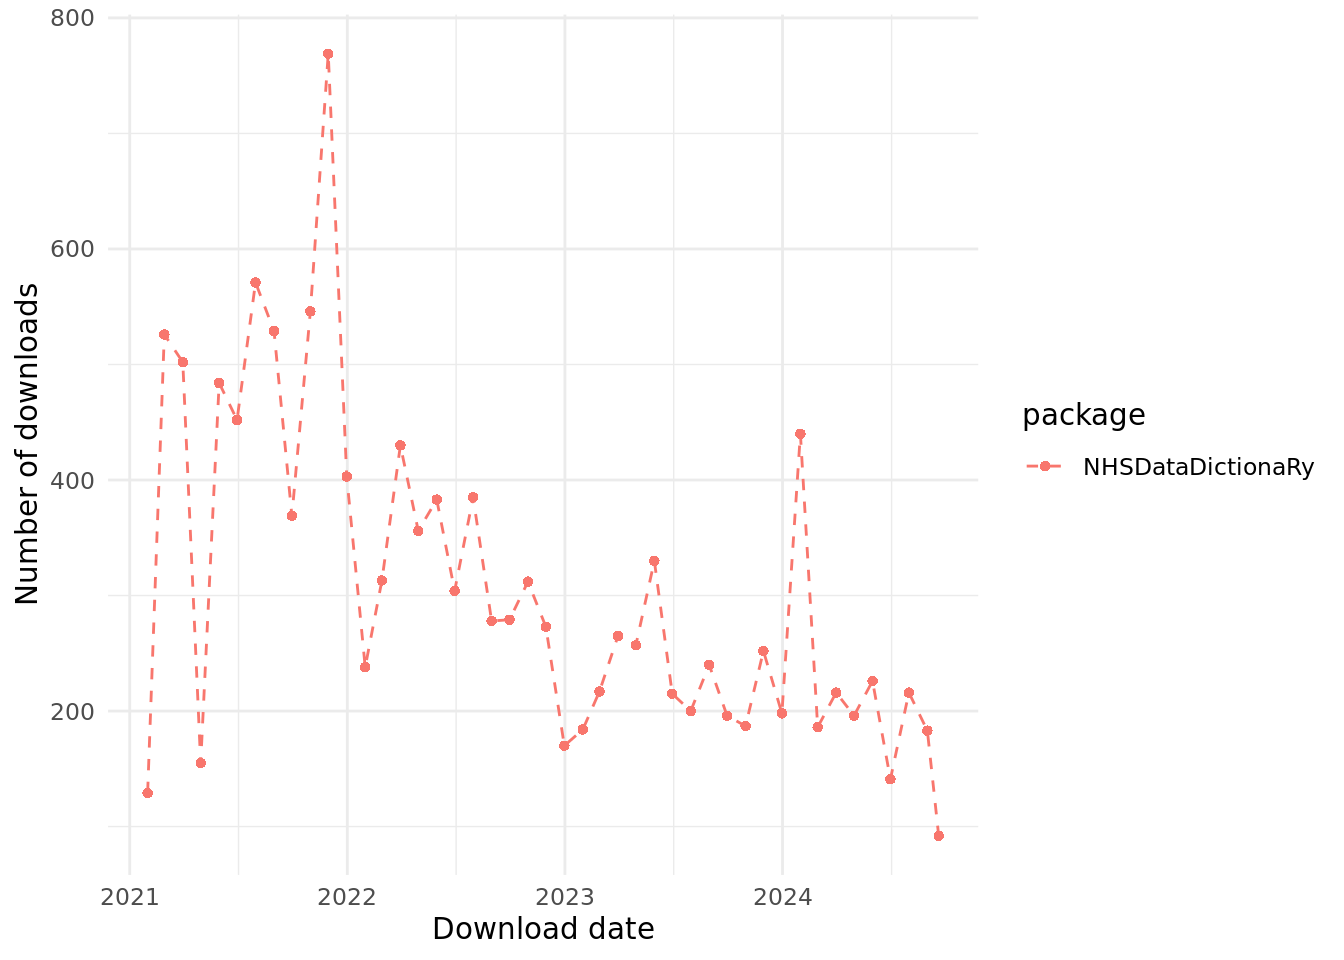
tracking$downloads_to_date[1] 13791To close…
I hope this simple wrapper can be useful for tracking your packages when they get to CRAN and provide some much needed reassurance that what you are developing is being used in the wild.
Reuse
CC0
Citation
For attribution, please cite this work as:
Hutson, Gary. 2021. “Tracking and Getting Download Statistics for
Your R Packages.” September 8, 2021. https://nhs-r-community.github.io/nhs-r-community//blog/tracking-and-getting-download-statistics-for-your-r-packages.html.