I saw on the NHS-R Community slack channel that the much sought after Forecasting R Workshop led by Bahman Rostami-Tabar was moving to a virtual environment whilst most of the country was shut due to the COVID pandemic. I had previously read the “Forecasting: Principles and Practice” online textbook from cover to cover and learnt the ‘motions’ of time series forecasting but hadn’t really understood the ‘why’. I had used previously black-box style models (Prophet), and understood how to make it work rather than why it works. I was looking forward to the course cementing some of the fundamentals in theory, and then refine the practice in the software.
It delivered.
Looking back through the 12 pages of notes I took to go alongside the excellent content produced by Bahman, we covered a huge amount in 6 short, two hour sessions.
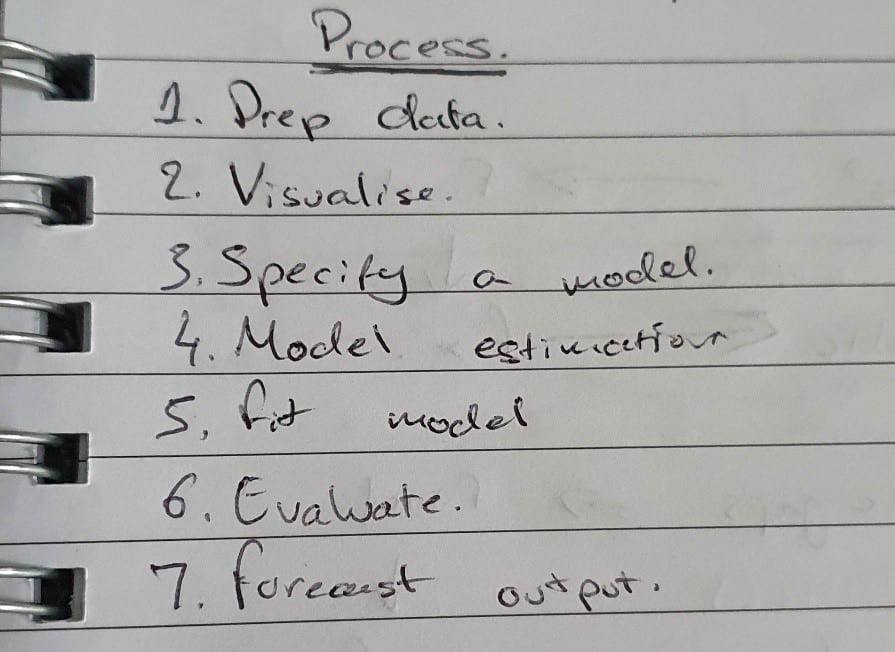
Before even picking up a dataset however, we talked through some of the key factors behind forecasting – the high level process, when we might want to or when we might not want to do it, and in which context it works best.
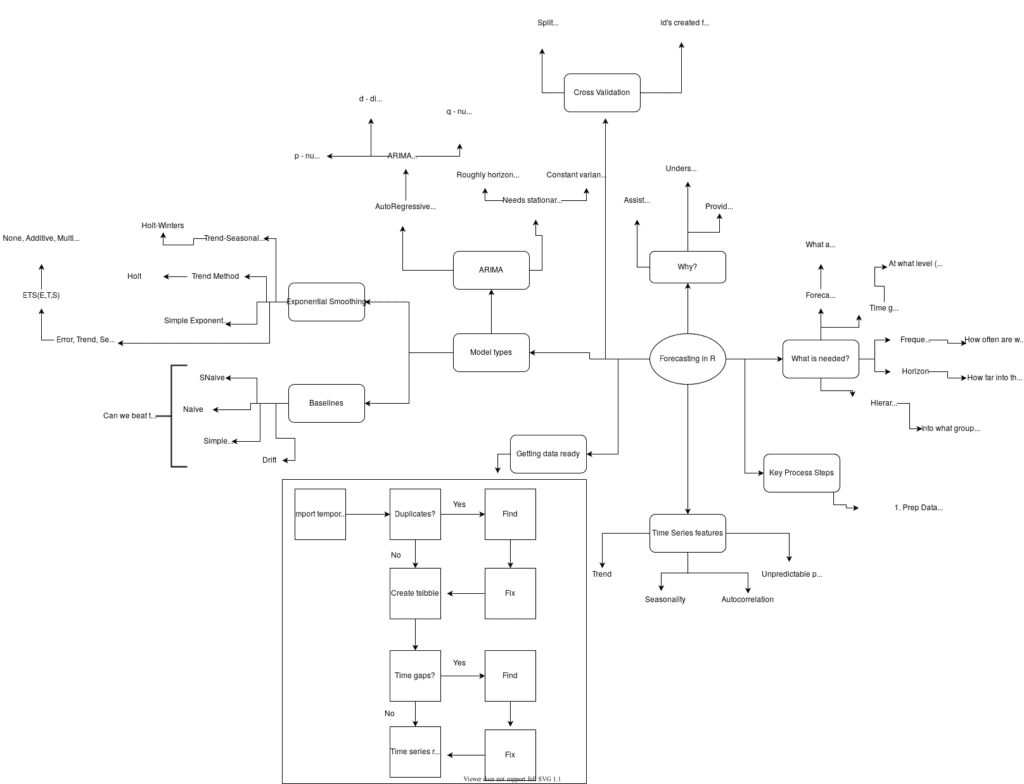
Another key item before diving in that we covered were some of the key ‘glossary’ terms that are used, such as the difference between frequency (the time intervals between points in your prediction) and horizon (how far into the future you are going to make your prediction). For some, this might be bread and butter, but adding structure to the language of forecasting really helped me get it clear in my head.
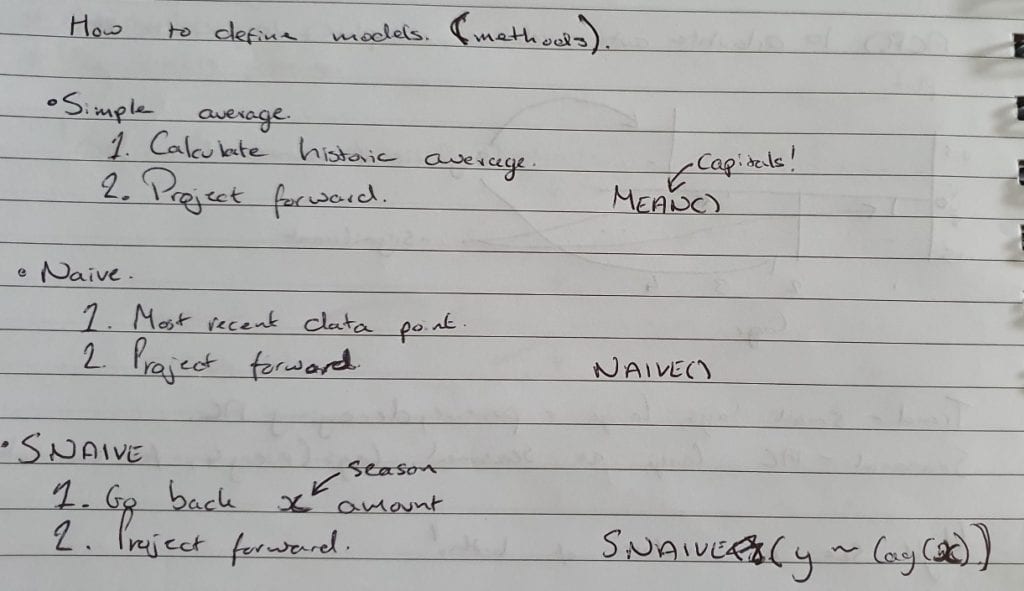
We spent a good share of the sessions looking at the theory of forecasting, and intermingled this with sessions in R. We moved through baseline predictions using simple average, naïve, seasonal naïve and drift methods (and their corresponding functions) through to exponential smoothing, auto-regressive integrated moving average (ARIMA) and regression.
We also looked at several measures within the forecasting toolbox, such as residual diagnostics and forecasting errors. It was going through these that asking Bahman to pause and explain in a bit more detail some of these concepts that really set an instructor led course in a league above trying to work through a textbook, re-reading the same cryptic passage and still being none the wiser.
My key takeaway from the learning was that R makes it really easy to have a hands off approach to modelling (without a calculator in sight!), but picking apart some of the automation meant I was able to convey what was happening back to colleagues from a much better informed perspective.
The virtual environment worked well from a pupil’s perspective, with some caveats. First, I found that reading the pre-session work was vital. Although Bahman was very open to going back over content, the pace at which we had to move was quick due to time constraints, so having a sense of the content beforehand really helped slot things in to place.
Alongside the reading, it was so important to have the lab scripts prepped and ready to go from day one. The NHSR Community team did a great job of getting the projects set up on RStudio Cloud, which meant that everything was ready to go, but if (like me) you wanted to get it running locally on your machine spending the time making sure your setup was working as expected prior to the first session was vital.
On the whole, I found the course both hugely enjoyable and informative. I am looking forward to integrating all that I learnt into my role as a demand and capacity analyst, finally feeling like I am coming from a perspective of understanding as to what methods to use and how they work. The instructor-led approach meant that I could finally get to grips with ideas that had been mystifying from just reading a textbook, for which I would like to extend my thanks to Bahman, Tom and Alysia for their work on running the course.
Paul Bullard, NHS England & NHS Improvement - Demand and Capacity Analyst
Back to top