I was interested in creating an animated graph in Shiny, which allows for an interactive input. As a mock example, I created an app which shows the distribution of a waitlist’s volume over time.
Excel offers the ability to easily create graphs, though when it comes to animating graphs, the process can be tricky, using complicated VBA. In my opinion, R is far better suited to dealing with this, due to the object oriented nature.
Simple, right?
When I first had a go with making a simple animated plot, I thought it would be as simple as:
- Create vector of distribution
- Plot this vector as a bar chart
- Update the new vector every time there is a trigger
Unfortunately, that’s when I ran into reactivity.
Reactivity
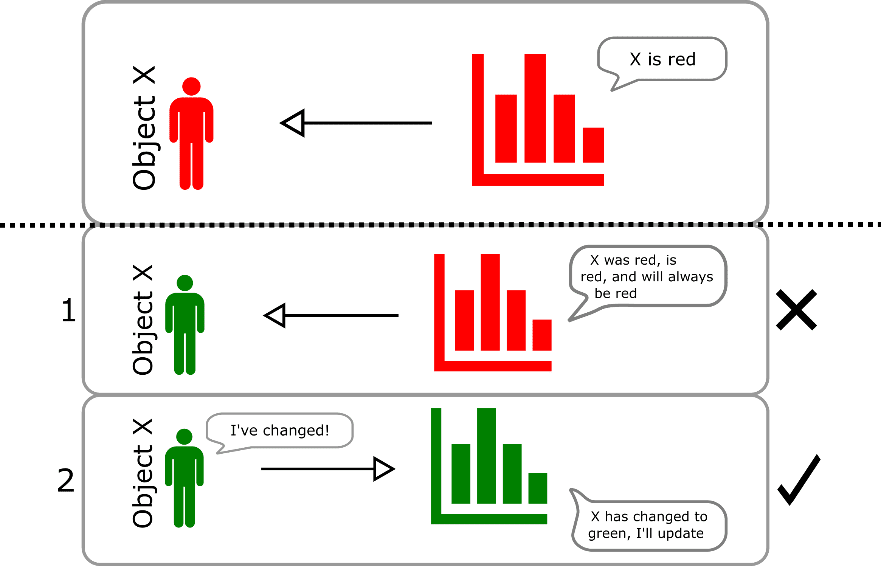
In short (and to my understanding), if you have anything in R Shiny that will be updated, it should be within a reactive environment. Flows of information in R work by pull, rather than push mechanisms. This means the data is “looked at” only when needed by the output (that is when it is created), but the data doesn’t push forward any change to the output if it updates.
Above, case 1 represents the normal situation in R once data has been updated. In case 2, a reactive environment is used, which effectively reverses the direction of the flow of information in R.
Another, perhaps more relatable way of interpreting reactivity, is to imagine reading in a csv file to a table in R called, for example, my_table. If you were to update values in the csv file, the object my_table would not be updated; it would require the data to be re-read into R.
Reactive objects can live inside something called reactiveValues(), which acts like a list. There are 2 ways to create / update this:
- Create the reactive list using
my_reactive_list \<- reactiveValues(), then update values in that list using\$(for examplemy_reactive_list$somedata <- c(1,20,23,42,98)) - Create the items while creating the list (for example
my_reactive_list <- reactiveValues(somedata = c(1,20,23,42,98)))
To then use this data, simply call the object from the output you would like to use it for. For example, ggplot(my_reactive_list$somedata). When somedata changes, so will the plot output.
It is worth noting that, just like lists, items within the reactiveValues() object are not limited to vectors.
More about reactivity can be found on the Shiny page:
https://shiny.rstudio.com/articles/understanding-reactivity.html
Code Here is the code I used to create this app:
https://github.com/danyaalmohamed/R/blob/master/animatedshiny.r
Though the code is long, a large proportion of that is for inputs and layouts; a basic animated graph can be created using some more simple code:
Data in reactiveValues() form A plot output A trigger, you could use an actionButton(), or a reactiveTimer()Shiny consists of a ui and a server element. Any visuals (for example a button, a plotoutput()) should be held within the ui, then any functions or calculations which happen behind the scenes should live within the server function.
I generally find it useful to use a series of small functions in R, and especially in Shiny. Instead of putting all the code inside of an actionButton, calling a function allows scope to implement it with different triggers, such as a reactiveTimer, or looping. It also allows for easier reading, in my opinion.
When initially attempting to create the app, I was taken back by the complexity of Shiny, and faced a steep learning curve. I took a few days to learn the basics, and after some practice I feel I know what is available in the Shiny toolbox, and some ways to work around problems.
Dan Mohamed, Undergraduate Analyst at the NHS Wales Delivery Unit.
This blog has been formatted to remove Latin Abbreviations and edited for NHS-R Style.